 The following is a list of the major water resources management problems in Indonesia.
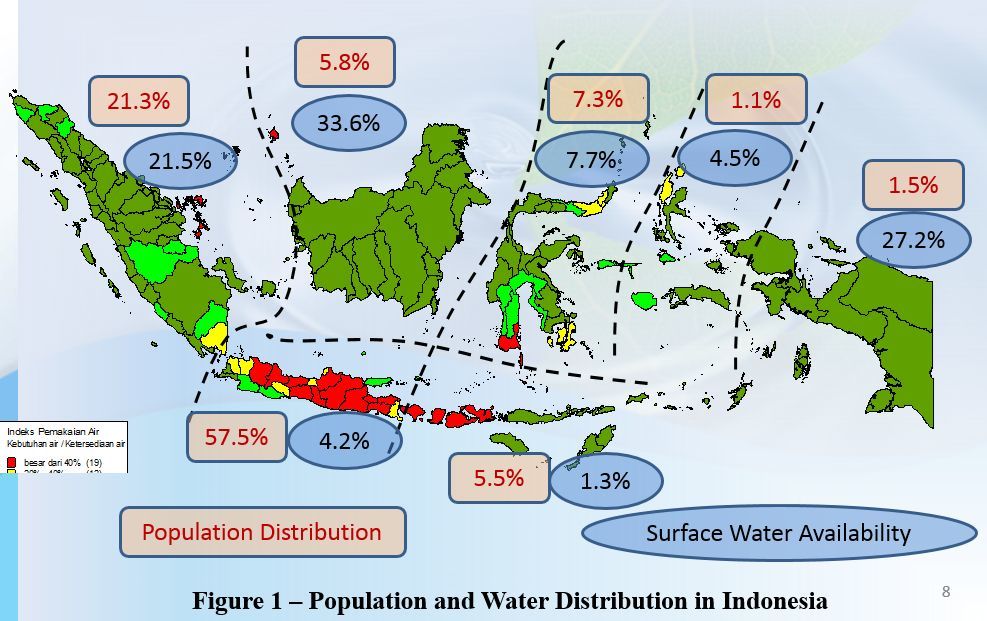
- Time and spatial water distribution
- 80% of the water available during the rainy season (5 months); 20% during the dry season
- 5% of the population resides in Java Island with only 4.2% of the national potential water resources
- Rapidly increasing water usage and water quality degradation
- Rapid population growth and density and various national development activities
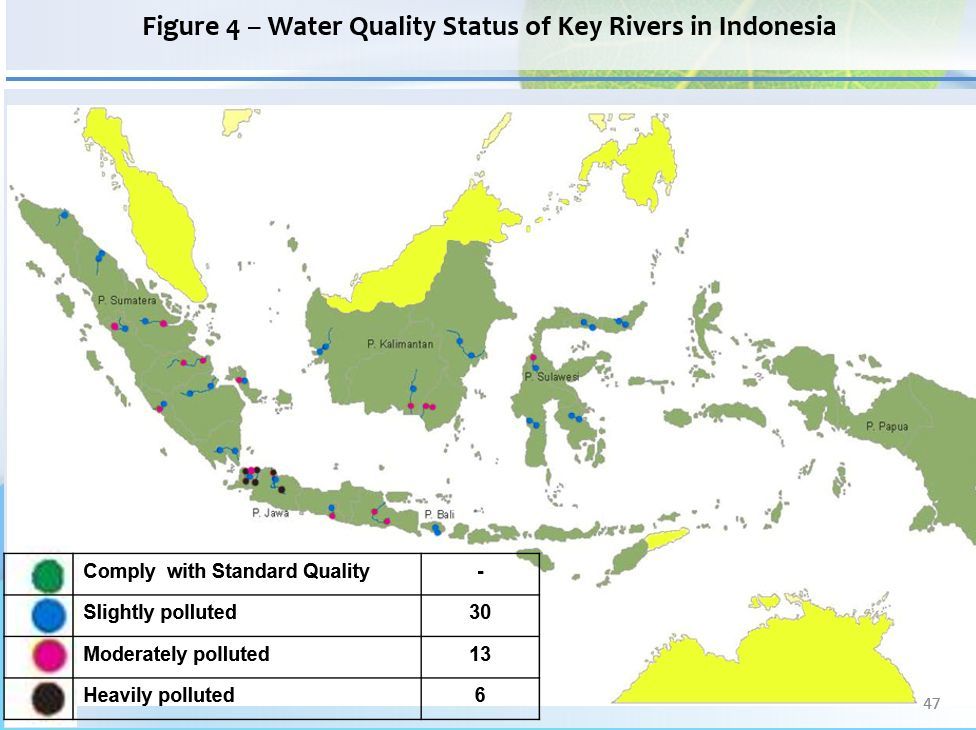
- Escalating water pollution
- Increasing inter-sector competition for water and declining public water resources sector efficiency
- Water resources degradation and depletion
- Widespread deforestations
- Improper mining practices
- Land use change & rapid plantation expansions in the upper watersheds
- Water infrastructure quality degradation
- Water reservoirs sedimentation
- Water resources and irrigation infrastructure maintenance
- Financing approach
- Investment-based and supply-side government investment on water resources infrastructures
- Lack of beneficiaries role and community participations
- Water Supply Management
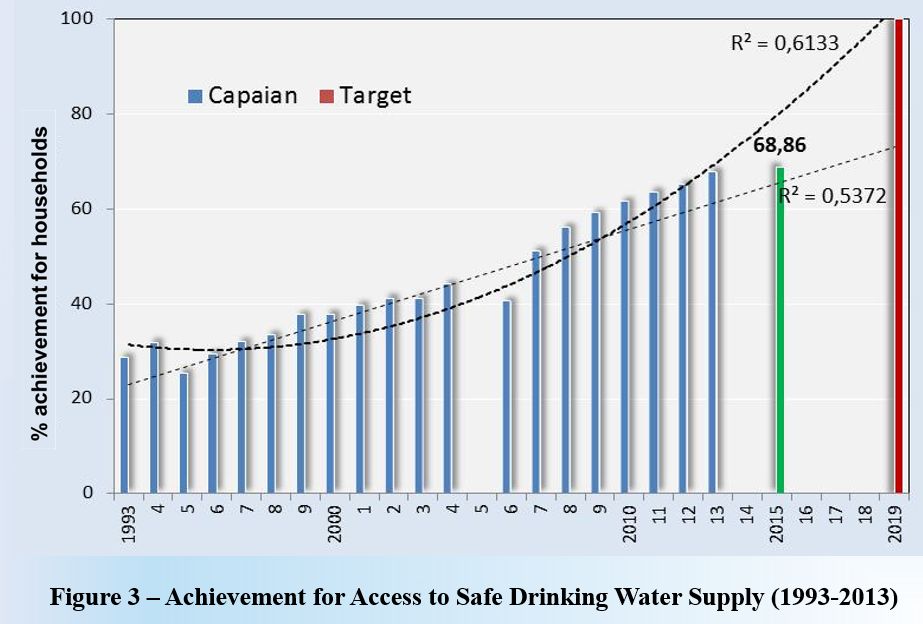
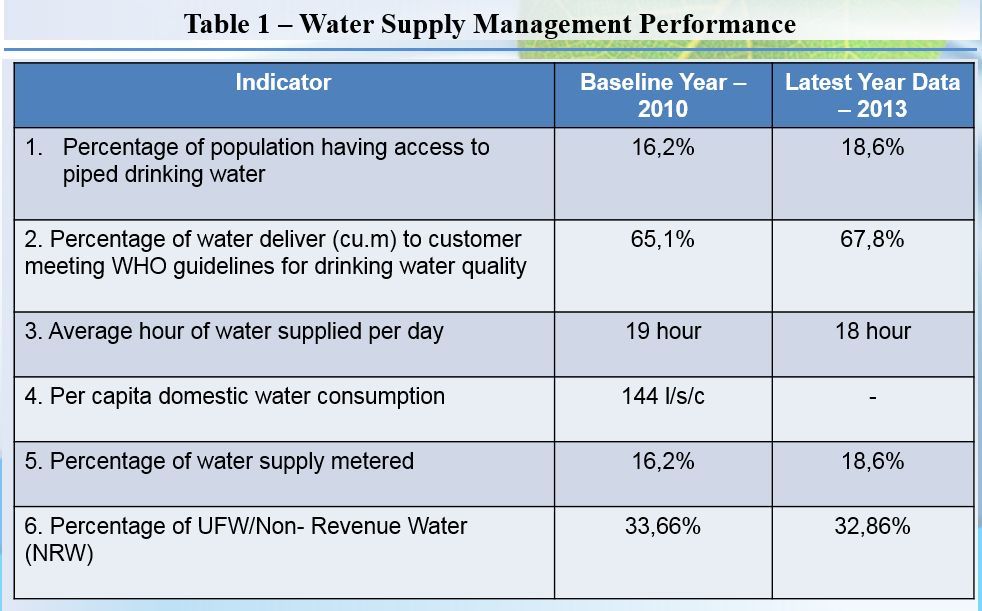 Figure 3 shows the achievement in the provision of access to safe drinking water supply in Indonesia for the two decades from 1993 to 2013. It can be seen from Figure 3 that the access to safe drinking water supply is growing rapidly at a non-linear rate in the last 8 years. Thus, it can be concluded that the MDG target will most probably be exceeded.
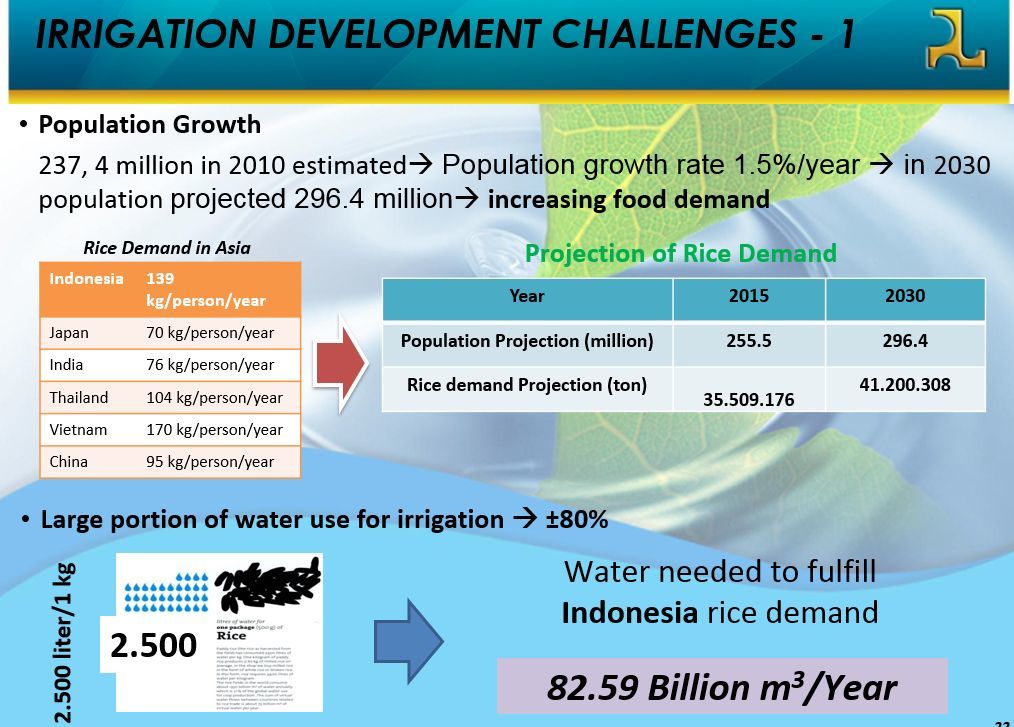
- Irrigation Management
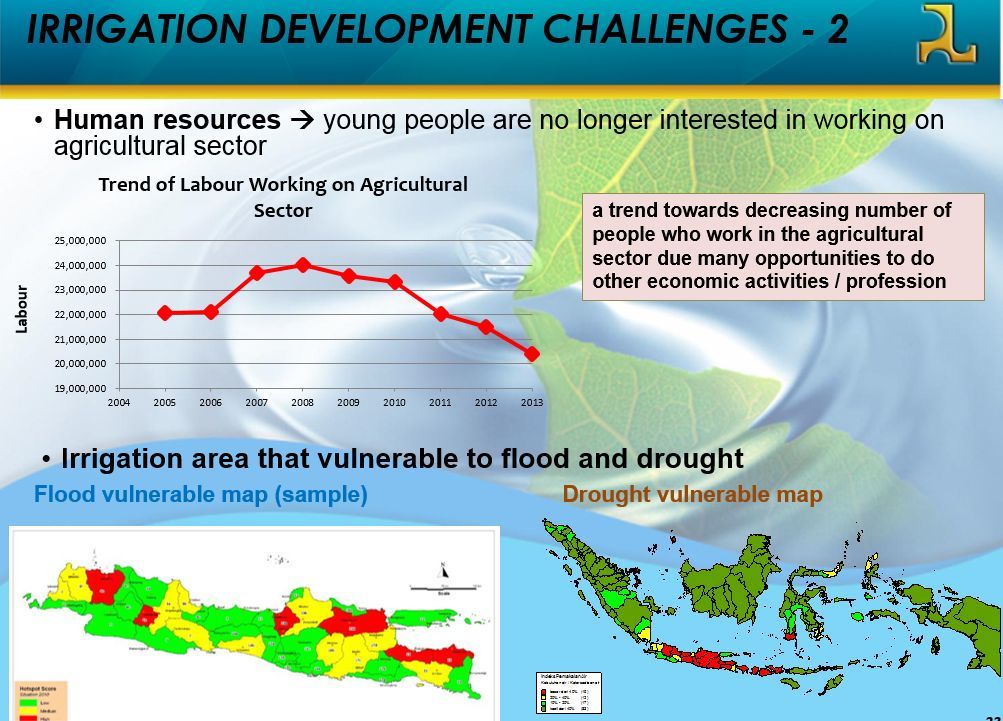
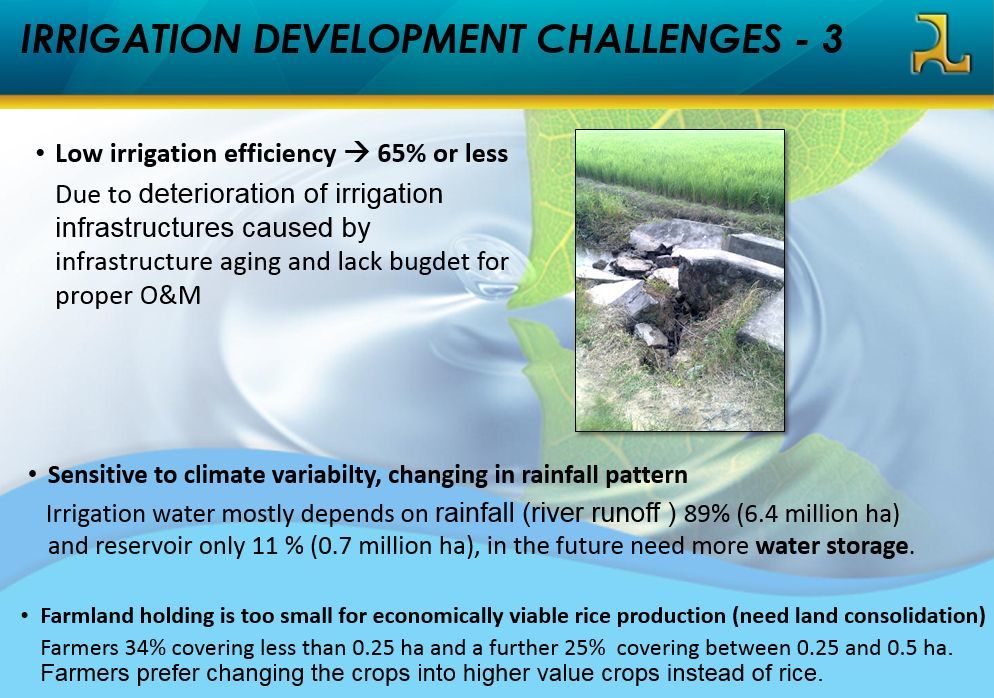
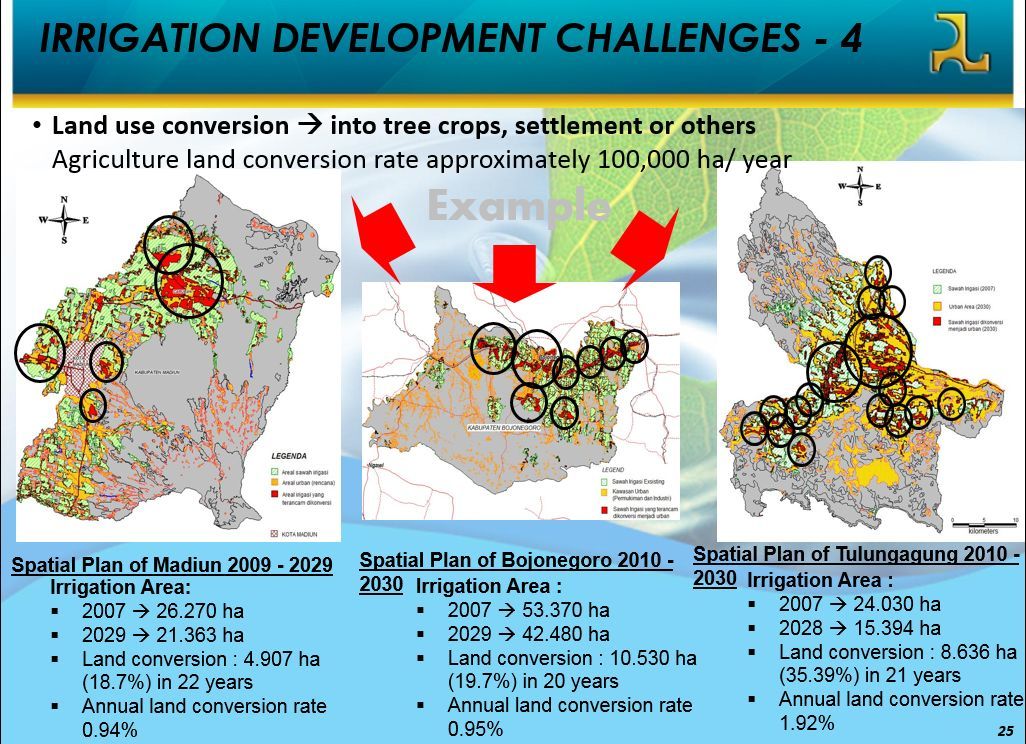
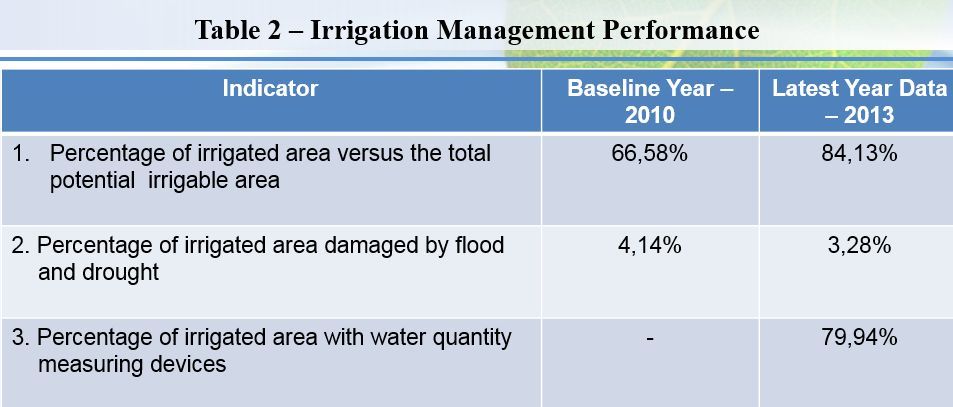 The following four figures summarizes the four major irrigation development challenges.
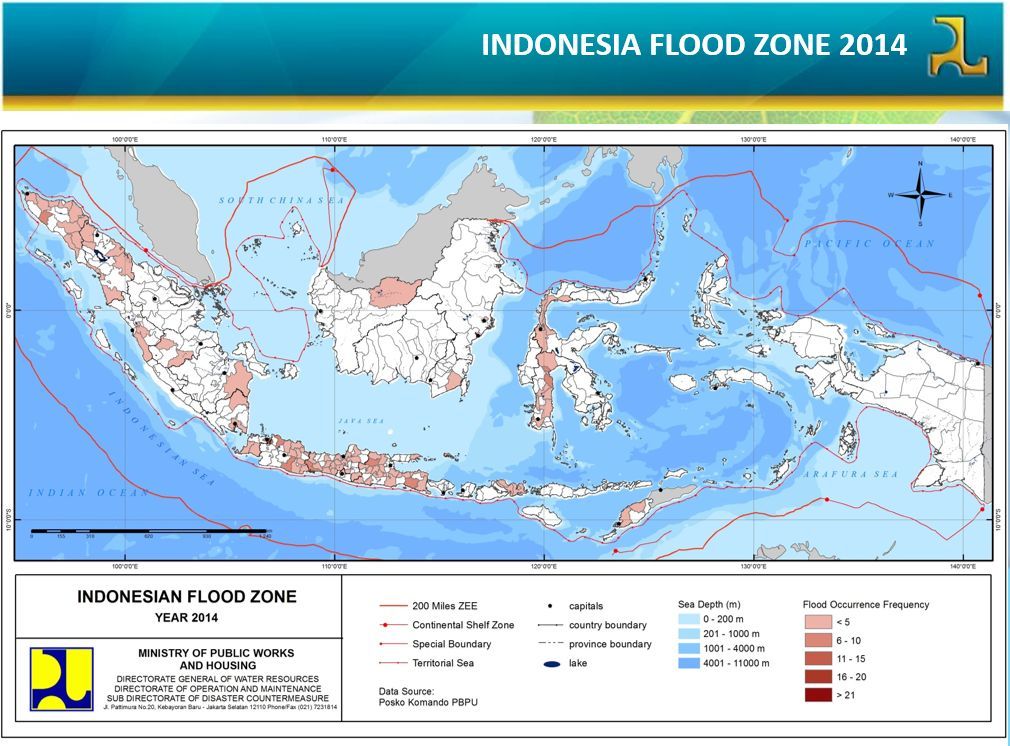
- Flood and Stormwater Management
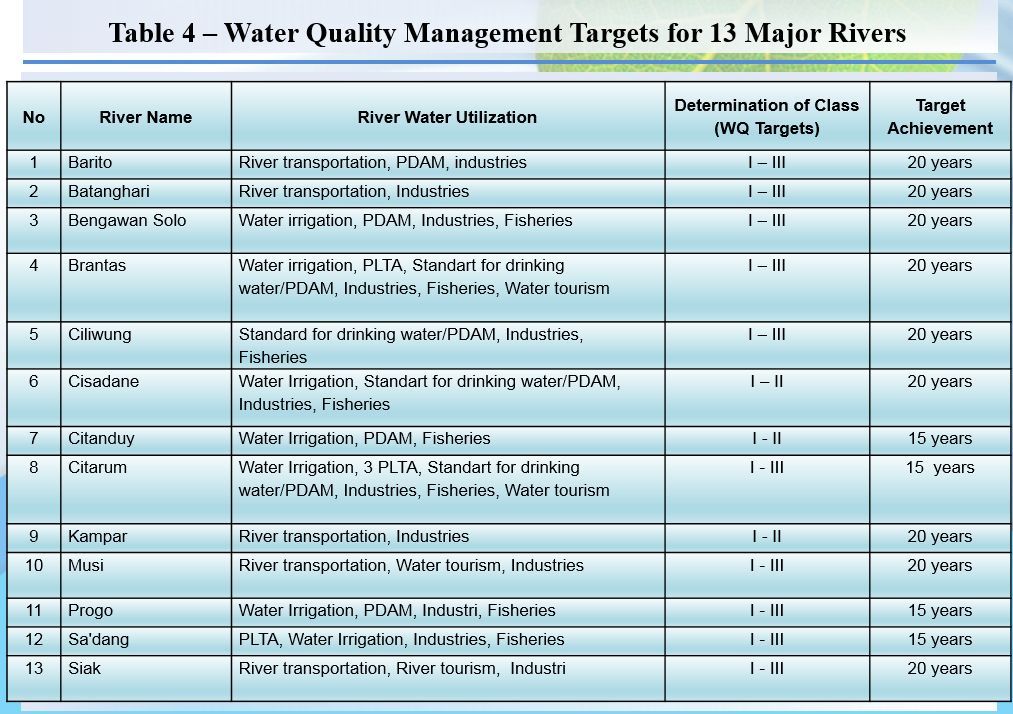
- Water Pollution Management
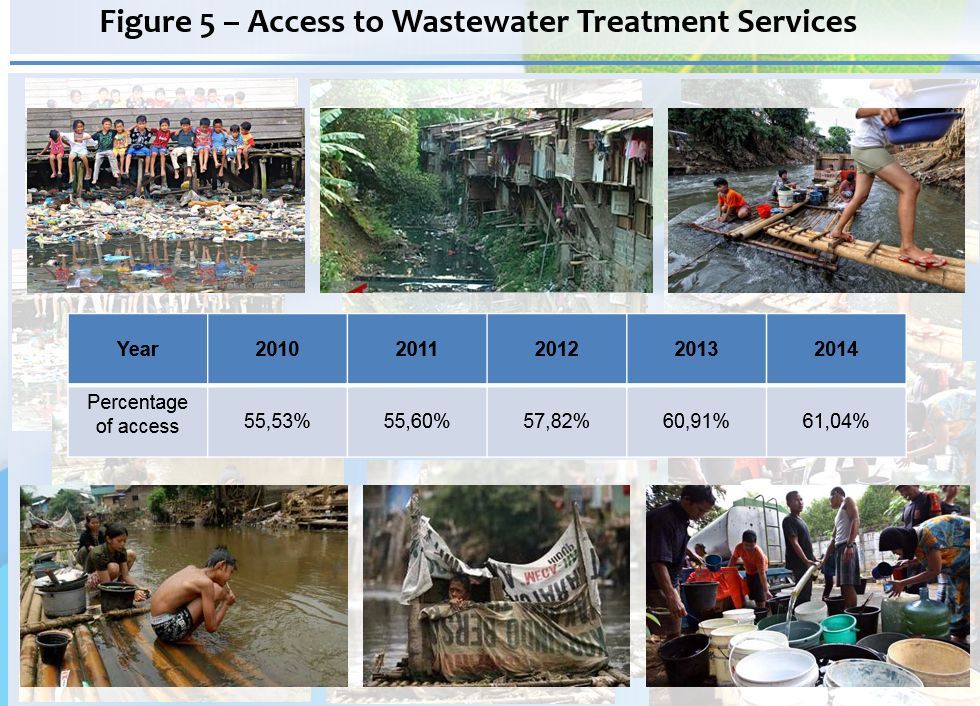
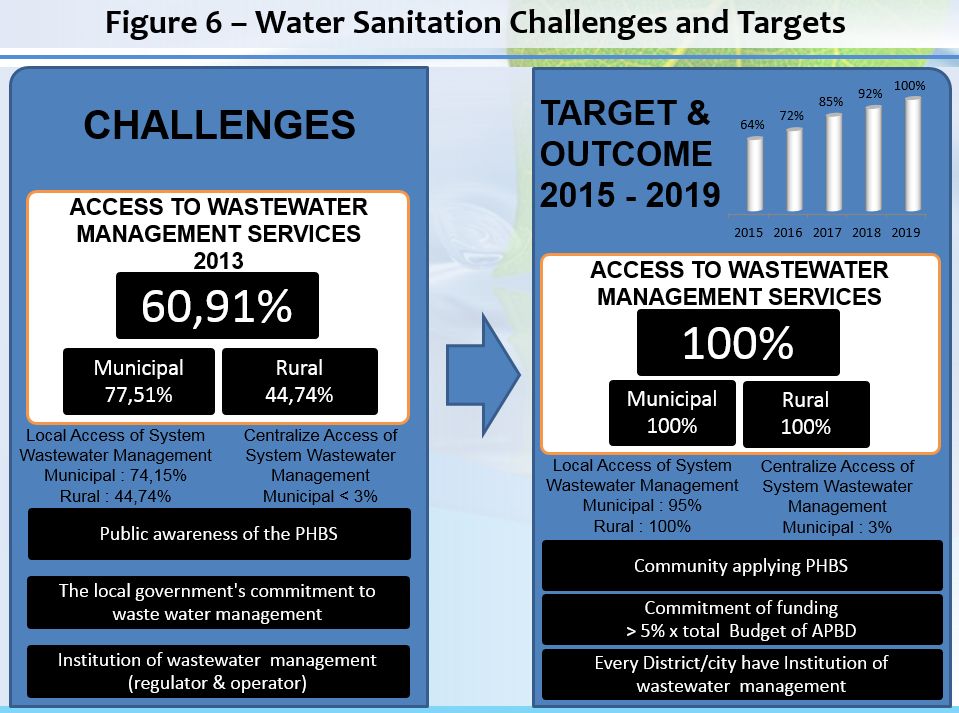
- Sanitation Management